|
|||||||||||||||||||||||||||||||||||||||||||||||||||||||||||||||||||||||||||||||||||||||||||||||||||||||||||||||||||||||||||||||||||||||||||||||||||||||||||||||||||||||||||||||||||||||||||||||||||||||||||||||||||||||||||||||||||||||||||||||||||||||


| PB | Performance Bound (perfect control based on Model Predictive Control) |
| RBC-A | Rule-Based Control, variant A |
| RBC-B | Rule-Based Control, variant B |
 HVAC system
| S1 | Blinds, lighting, cooled ceiling, free cooling, and radiators |
| S2 | Same as S1 plus mechanical ventilation with energy recovery |
| S3 | Blinds, lighting, and mechanical ventilation with energy recovery |
Site
| Zurich | Central European climate with frequent temperature inversions/foggy conditions during autumn and winter |
| Vienna | Transition from oceanic climate to humid continental climate with cold winters and warm summers |
| Lugano | Moderate annual temperature variation, sunny winter climate, heavy rainfalls during autumn and spring |
| Marseille | Mild, dry winters and hot, sunny summers mitigated by a sea breeze |
Facade orientation
| North | Building zone with North facing facade |
| South | Building zone with South facing facade |
| South+East | Corner zone with South plus East facing facade |
| South+West | Corner zone with South plus West facing facade |
Construction type
| Heavyweight | cdyn ≈ 80 Wh/m2K |
| Lightweight | cdyn ≈ 36 Wh/m2K |
where cdyn denotes the internal dynamic heat capacity of the building zone.
Building standard
| Swiss average | Uop ≈ 0.6 W/m2K, Uwin ≈ 2.8 W/m2K |
| Passive house | Uop ≈ 0.1 W/m2K, Uwin ≈ 0.7 W/m2K |
where Uop and Uwin denote the overall heat transfer coefficients of opaque facade parts and of windows including frames, respectively.
Window area fraction
| Low | 30% window area per facade |
| High | 80% window area per facade |
Internal heat gains level
| Low | Occupants gains 5 W/m2/person, equipment gains 7 W/m2 |
| High | Occupancy gains 9 W/m2/person, equipment gains 15 W/m2 |
Thermal comfort
| Wide, outside air temperature dependent |
Indoor air quality
| Non-air quality controlled ventilation |
Mechanical ventilation – if present – was operated using a fix schedule, with margins of 1h before/after begin of work.
Illuminance comfort
| Occupancy dependent, bright |
Applied was a lower illuminance setpoint value for occupied offices of 500 lux. No upper limit was defined, assuming that in case of excess incoming solar radiation the user would be able to obtain glare protection by manual adjustment of an internal blind.
Energy system
| Heat: earth coupled heat pump; Cold: mechanical (compression) chiller |
Control costs
| Primary energy |
Building type
| Office building |
Weather data
| DRY (Design Reference Year) |
Control algorithm
| PB | Performance Bound (perfect control based on Model Predictive Control) |
| RBC-A | Rule-Based Control, variant A |
| RBC-B | Rule-Based Control, variant B |
HVAC system
| S1 | Blinds, lighting, cooled ceiling, free cooling, and radiators |
| S2 | Same as S1 plus mechanical ventilation with energy recovery |
| S3 | Blinds, lighting, and mechanical ventilation with energy recovery |
Site
| Zurich | Central European climate with frequent temperature inversions/foggy conditions during autumn and winter |
| Vienna | Transition from oceanic climate to humid continental climate with cold winters and warm summers |
| Lugano | Moderate annual temperature variation, sunny winter climate, heavy rainfalls during autumn and spring |
| Marseille | Mild, dry winters and hot, sunny summers mitigated by a sea breeze |
Facade orientation
| North | Building zone with North facing facade |
| South | Building zone with South facing facade |
| South+East | Corner zone with South plus East facing facade |
| South+West | Corner zone with South plus West facing facade |
Construction type
| Heavyweight | cdyn ≈ 80 Wh/m2K |
| Lightweight | cdyn ≈ 36 Wh/m2K |
where cdyn denotes the internal dynamic heat capacity of the building zone.
Building standard
| Swiss average | Uop ≈ 0.6 W/m2K, Uwin ≈ 2.8 W/m2K |
| Passive house | Uop ≈ 0.1 W/m2K, Uwin ≈ 0.7 W/m2K |
where Uop and Uwin denote the overall heat transfer coefficients of opaque facade parts and of windows including frames, respectively.
Window area fraction
| Low | 30% window area per facade |
| High | 80% window area per facade |
Internal heat gains level
| Low | Occupants gains 5 W/m2/person, equipment gains 7 W/m2 |
| High | Occupancy gains 9 W/m2/person, equipment gains 15 W/m2 |
Thermal comfort
| Wide, outside air temperature dependent |
Indoor air quality
| Non-air quality controlled ventilation |
Mechanical ventilation – if present – was operated using a fix schedule, with margins of 1h before/after begin of work.
Illuminance comfort
| Occupancy dependent, bright |
Applied was a lower illuminance setpoint value for occupied offices of 500 lux. No upper limit was defined, assuming that in case of excess incoming solar radiation the user would be able to obtain glare protection by manual adjustment of an internal blind.
Energy system
| Heat: earth coupled heat pump; Cold: mechanical (compression) chiller |
Control costs
| Primary energy |
Building type
| Office building |
Weather data
| DRY (Design Reference Year) |
|
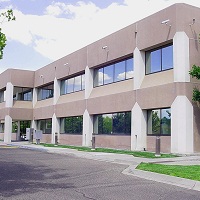
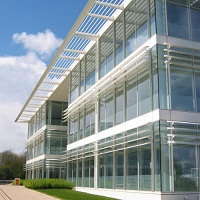
Building A Building B
Total energy
Heating Cooling Lighting Ventilation Electric lighting Fan operation Radiator heating Heating mech. ventilation Cooling mech. ventilation Cooled ceiling, chiller Cooled ceiling, free cooling Building A Building B Building A Building B Building A Building B Building A Building B |
BackgroundBACTool focuses on the exploration of so-called "non-standardized" control solutions, i.e. solutions where the control is being tailored to the given building, combination of automated subsystems and user requirements by means of corresponding programs that govern the behavior and interplay of the individual subsystems. Building automation systems with programmable controllers are typically used for that purpose. Traditional programs are susbsumized under the term Rule-Based Control (RBC). A promissing alternative that is currently undergoing intensive research is co-called Model Predictive Control (MPC). A brief introduction to RBC and MPC is given below. A more in-depth discussion of the two approaches and a comprehensive list of criteria for the evaluation of non-standardized control solutions is given in [1] (in particular see the Introduction therein). All data presented in the BACTool are simulation results. They were produced using the data and methods described in [1]. The simulations were based on a 12th order multiple-input-multiple-output bilinear model of the coupled thermal, light and air quality dynamics of a single room or building zone. The model is used, firstly, as a "plant model" to simulate the building zone's response to different control algorithms. Secondly, the same model is also used as a "controller model" for Model Predictive Control (see below). Details on the model can be found in [2] and [5]. Each simulation covered one year and employed a time step of one hour. The used weather data sets are documented in [6]. Statistical analyses dealing with trends and patterns across a large number of simulations are provided in [7],[8],[9],[10]. A more detailed analysis of selected cases can be found in [8]. Control AlgorithmsRule-Based Control (RBC) determines the control inputs based on a series of rules of the kind "if condition then action". The conditions and actions typically involve numerical parameters (e.g., threshold values), the so-called control parameters. In BACTool they are determined from building parameters based on carefully derived, automated calculation procedures. The used RBC algorithms consist of a high-level and a low-level part. The high-level part yields operating modes that determine the "low-cost" actions (blind positioning, free cooling operation, and energy recovery operation). The low-level part determines, firstly, the control actions for the "low-cost" action aggregates. In a second step it calculates the remaining control outputs for "high-cost" actions such as active heating or cooling, and mechanical ventilation. The various RBC variants differ only in their high-level parts. For further information see [3] Model Predictive Control (MPC) relies upon a model of the building that is used together with predictions of relevant disturbances (e.g., weather, internal gains) to predict the system's future evolution. At the beginning of each time step (e.g., every hour) MPC computes the "best possible" sequence of control actions that minimize a cost function (e.g., total energy demand) over a given prediction horizon (e.g., a few days) while respecting comfort (e.g., illumination levels, room temperature range) and any other (e.g., maximum power demand) constraints. The control actions identified for the very first time step within the prediction horizon are then applied to the system, and the whole procedure is repeated at the beginning of the next time step. This "receding horizon" approach ensures that the control plan is continuously updated using the newest information on the building's state, thus allowing to account for model inaccuracies or any unknown disturbances that have meanwhile acted on the building. See also [4]. The Performance Bound (PB) is a theoretical value that presents the lowest achievable control cost (in terms of energy or money) for a given building, cost function, disturbances (weather, internal gains) and set of comfort requirements. The PB can be estimated by applying Model Predictive Cnotrol (see below) over a representative period (e.g., one year) assuming a perfect building model, and perfect knowledge of all future disturbances. Knowledge of the PB makes it possible to compare different design variants for a given system net of any effects related to control. Theoretical energy savings potential: By definition the PB presents a theoretical number that can not be beaten by any real controller. The difference between a real controller's energy usage and the PB gives a measure of the maximum achievable improvement for that controller. Nothing can be said about to what extent the potential can be exploited by a feasible control. However, the size of the potential indicates for what applications further control strategy development may be promising.
Note, the set of subsystems actually controlled by a given control algorithm depends on the currently chosen HVAC System variant. Sites
Internal GainsThe occupancy density of the building (a number ranging from 0-100%) was used as the key quantity to determine the internal heat gains from persons and equipment, plus CO2 production. Considered were two internal gains levels based on the Swiss standard SIA 2024 [11].
Diurnal and weekly variations in internal gains were obtained from the Swiss standard SIA 2024 [11] for cellular offices. During weekends no persons were assumed to be present and the person gains were set to zero. The equipment gains were set to the weekdays' night-time value. Thermal ComfortThe used minimum and maximum room temperature set points for heating and cooling were similar to the definitions in SIA 382/1 [12]. 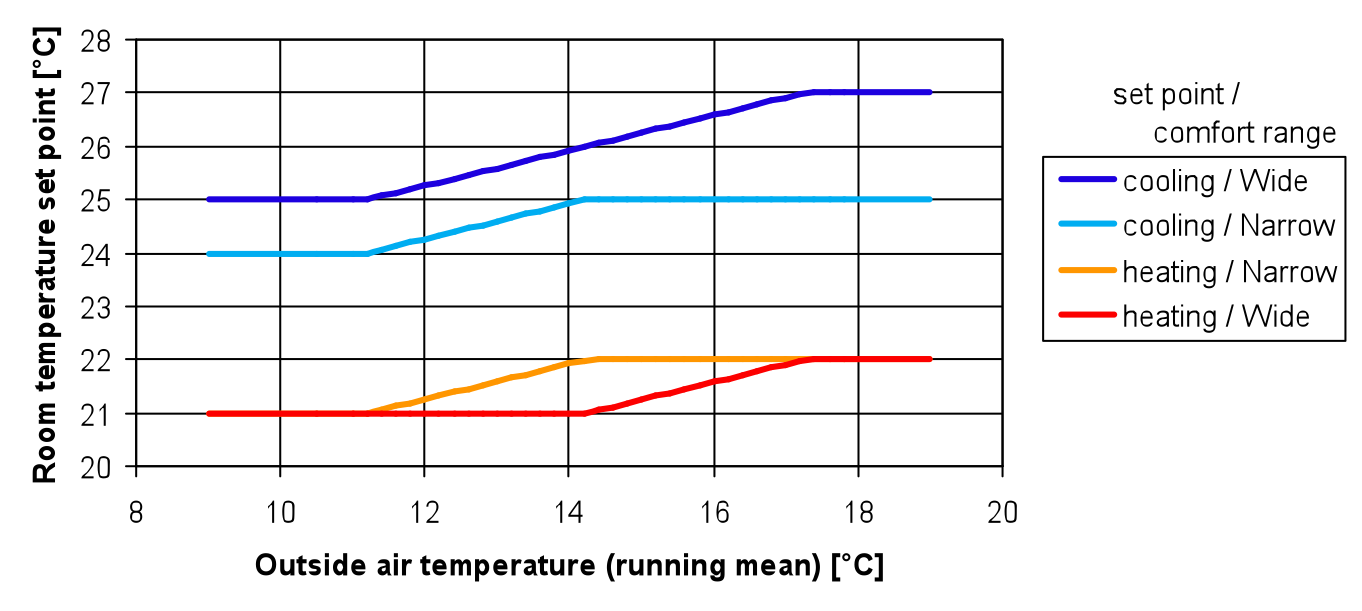
The actual range at a given point in time was determined as a function of the exponentially weighted running mean of the past measured outside air temperature values. The running mean was calculated in a similar manner as described in EN 15251 [13]. The comfort settings were applied 24 hours a day and 7 days a week. References
|
||||||||||||||||||||||||||||||||||||||||||||||||||||||
PublisherAutomatic Control Laboratory, ETH Zurich EditorDimitrios Gyalistras and the OptiControl Team ProgrammingJan Siroky System ResponsibleIT Support Group, D-ITET/ETH Zurich |
Initiated by
Supported by
|